Creating an ASP.NET report using Visual Studio 2010 - Part 1Creating an ASP.NET report using Visual Studio 2010 - Part 2Adding the ReportViewer control and filter drop downs.
Open the source code for index.aspx and add a ScriptManager control. This control is required for the ReportViewer control. Add a DropDownList for the categories and suppliers. Add the ReportViewer control. The markup after these steps is shown below.
<div>
<asp:ScriptManager ID="smScriptManager" runat="server">
</asp:ScriptManager>
<div id="searchFilter">
Filter by: Category :
<asp:DropDownList ID="ddlCategories" runat="server" />
and Supplier :
<asp:DropDownList ID="ddlSuppliers" runat="server" />
</div>
<rsweb:ReportViewer ID="rvProducts" runat="server">
</rsweb:ReportViewer>
</div>
The design view for index.aspx is shown below. The dropdowns will display the categories and suppliers in the database. The report will be filtered by the selections in the dropdowns. You will see how to do this in the next steps.
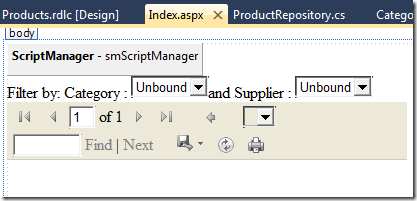
Attaching the RDLC to the ReportViewer control by clicking on the top right of the control, going to Report Viewer tasks and selecting Products.rdlc.

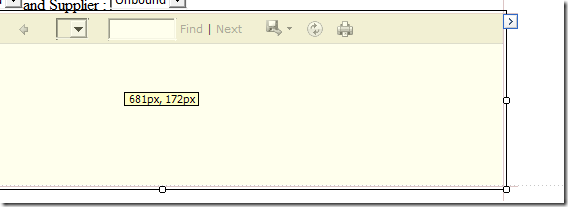
Resize the ReportViewer control by dragging at the bottom right corner. I set mine to
800px x 500px. You can set this value in source view also.
 Defining the data sources.
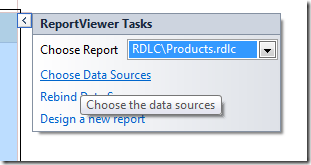
We will now define the Data Source used to populate the report. Go back to the “ReportViewer Tasks” and select “Choose Data Sources”
Select a “New data source..”
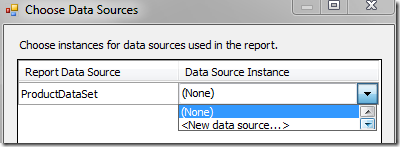
Select “Object” and name your Data Source ID “odsProducts”
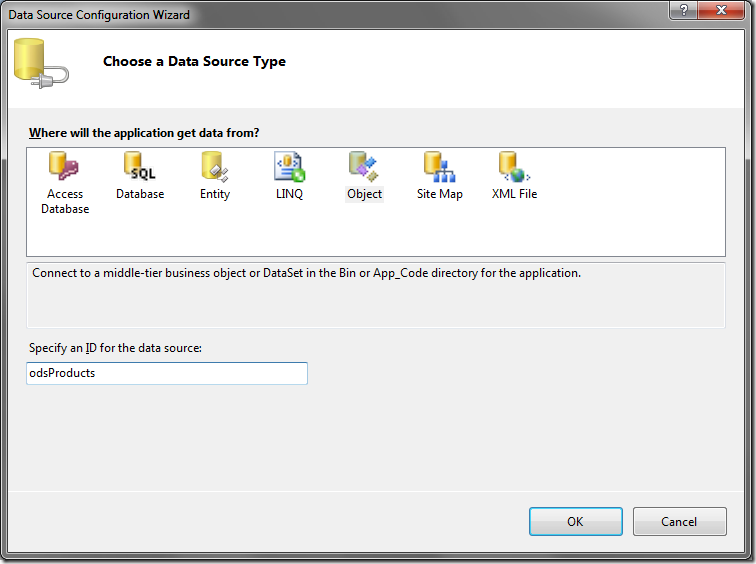
In the next screen, choose “ProductRepository” as your business object.

Choose “GetProductsProjected” in the next screen.
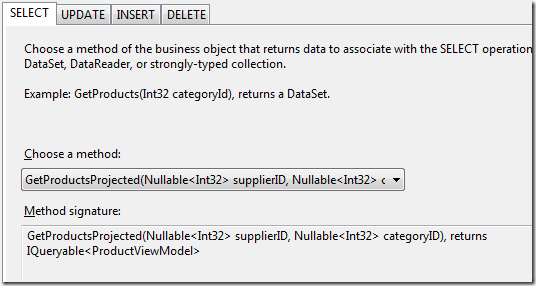
The method requires a SupplierID and CategoryID. We will have the data source use the selected values of the drop down lists we defined earlier. Set the parameter source to be of type “Control” and set the ControlIDs to be
ddlSuppliers and ddlCategories respectively. Your screen will look like this:

We are now going to define the data source for our drop downs. Select the ddlCategory drop down and pick “Choose Data Source”.

Pick “Object” and give it an id “odsCategories”

In the next screen, choose “ProductRepository”

Select the GetCategories() method in the next screen.

Select “CategoryName” and “CategoryID” in the next screen. We are done defining the data source for the Category drop down.
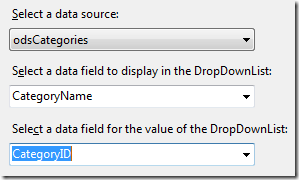
Perform the same steps for the Suppliers drop down.


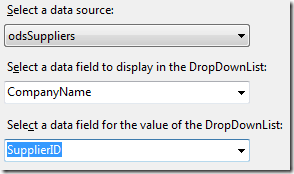
Select
each dropdown and set the AppendDataBoundItems to true and AutoPostback to true.

The AppendDataBoundItems is needed because we are going to insert an “All“ list item with a value of
empty. This will be the first item in each drop down list. Go to each drop down and add this list item markup as shown below.

Double click on each drop down in the designer and add the following code in the code behind. This along with the “Autopostback= true” attribute refreshes the report anytime the selection in the drop down is changed.
protected void ddlCategories_SelectedIndexChanged(object sender, EventArgs e)
{
rvProducts.LocalReport.Refresh();
}
protected void ddlSuppliers_SelectedIndexChanged(object sender, EventArgs e)
{
rvProducts.LocalReport.Refresh();
}
Compile your report and run the page. You should see the report rendered. Note that the tool bar in the ReportViewer control gives you a couple of options including the ability to export the data to Excel, PDF or word.
Conclusion
Through this three part series, we did the following:
- Created a data layer for use by our RDLC.
- Created an RDLC using the report wizard and define a dataset for the report.
- Used the report design surface to design our report including adding a chart.
- Used the ReportViewer control to attach the RDLC.
- Connected our ReportWiewer to a data source and take parameter values from the drop downlists.
- Used AutoPostBack to refresh the reports when the dropdown selection was changed.
RDLCs allow you to create interactive reports including drill downs and grouping. For even more advanced reports you can use
Microsoft® SQL Server™ Reporting Services with RDLs. With RDLs, the report is rendered on the report server instead of the web server. Another nice thing about RDLs is that you can define a parameter list for the report and it gets rendered automatically for you. RDLCs and RDLs both have their advantages and its best to compare them and choose the right one for your requirements.
Download VS2010 RTM Sample project
No comments:
Post a Comment